


 A26 A1-A44 B1-B24

Page A26
FEBRUARY 2017
FUNERAL HOME & CEMETERY NEWS
S ec t i on A
Trends and Insights
Just what happens to all the data collected by Johnson Consulting Group (JCG)? We
use it to help the profession! We took all of the sales and survey data collected through our
Performance Tracker™ program in the past two years, combined it and crunched it to un-
derstand trends, then used statistics to determine how family satisfaction is related to sales.
There were three parts to our analyses:
1. Comparison of sales data from 2014 and 2015
2. Comparison of family satisfaction survey data from 2014 and 2015
3. Correlation analysis to determine the relationship between sales and survey ratings
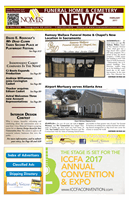
So you have an idea of the amount of data we analyzed, below shows the number of
at-need sales records and the number of survey responses we analyzed for each year:
• At-need cremations with memorials are showing significant growth in one year’s time.
We have a lot of information, and have included the key findings in this article. Read
on to understand the trends we are seeing and gain insight into how family satisfaction
affects your sales.
Key Findings
Dispositions and Case Types
• From 2014-2015 cremations rose 1.8%, and in 2015, about the same amount of
consumers chose traditional burial as those who chose direct cremation. The per-
centage of families selecting direct cremations rose about the same amount that tra-
ditional burials declined.
• Average per case dollar sales for pre-need burials declined 2.0%, which seems to be
replaced by the nearly 2% increase in per case pre-need cremation sales.
• Pre-need burial sales generated $1,331 less per case than at-need burials in 2015, and
average pre-need cremation sales per case were $692 higher than direct cremations.
To bridge the pre-need burial sales gap, ensure families know all options for services
that increase family satisfaction (and sales).
Overall Sales
• Looking at all case types combined, the
average sale per case is $5,051 – a de-
crease of $100, which is about 2%, in
just one year (2014 to 2015).
• This is likely a result of the increase in
families who chose less costly crema-
tions rather than burials.
• Combination funeral home and cemetery
firms show significant average per case
sales growth, whereas combination funer-
al home and crematory and direct cremation firms show decline from 2014. Standalone
funeral homes had the highest average per case sales both years of all funeral home types.
• As call volume increased, per case sales decreased, especially among the largest firms
which suggests that low prices may be driving volume.
• On average, firms in smaller markets (population
<50K) have higher per case sales than larger markets
– possibly a result of less competition. They also earn
higher overall satisfaction ratings than larger firms,
which might be a function of the personal relationship
the owner/staff enjoys with families in the small mar-
ket, resulting in better service provided.
CONTINUED ON PAGE A27Call 1-800-321-7479 or visit
www.funeralbusinessforsale.comUpload Photos and Videos!
ONE STOP SHOPPING
for new and used professional
coaches and limousines
Dealers and private sellers can
list vehicles creating a vast
database of cars for sale or
lease nationwide.